Author: Tai Nguyen
Introduction
„Tell us what the future holds, so we may know that you are god.” (Isaiah 41: 23)
As early as 700 years BC, the ability to make accurate forecasts was identified as a utopian task [1]. 2700 years later, the difficulty of this task has even tended to increase. In business, companies must accurately anticipate events and customer behavior. Complex interactions and a wide variety of parameters have to be taken into account when making forecasts. Based on many projects in different industries, it could be observed that from the customer’s side the focus is mostly on the selection of the forecasting algorithm, whereby the data quality of the input is often regarded as secondary, if not disregarded altogether. In this white paper, we will outline how you can use IBP to improve your data quality, turning a seemingly utopian task into a manageable challenge.
Garbage In, Garbage Out…
As described at the beginning, we want to deal with the data quality of the forecast input, since this contributes significantly to the avoidance of planning errors, in line with the saying “garbage in, garbage out”. Usually, the input is the sales history. However, the principle presented can be performed with any other key figure.
IBP offers various algorithms and methods for data cleansing. One of the methods is the Outlier Correction. Here, so-called outliers are identified and corrected as desired. These data points usually reflect atypical behavior, which can lead to false conclusions and thus to unrealistic forecasts. The occurrence of an outlier can be attributed to a wide variety of causes (e.g. delivery bottlenecks, a one-off large order, other events) [2].

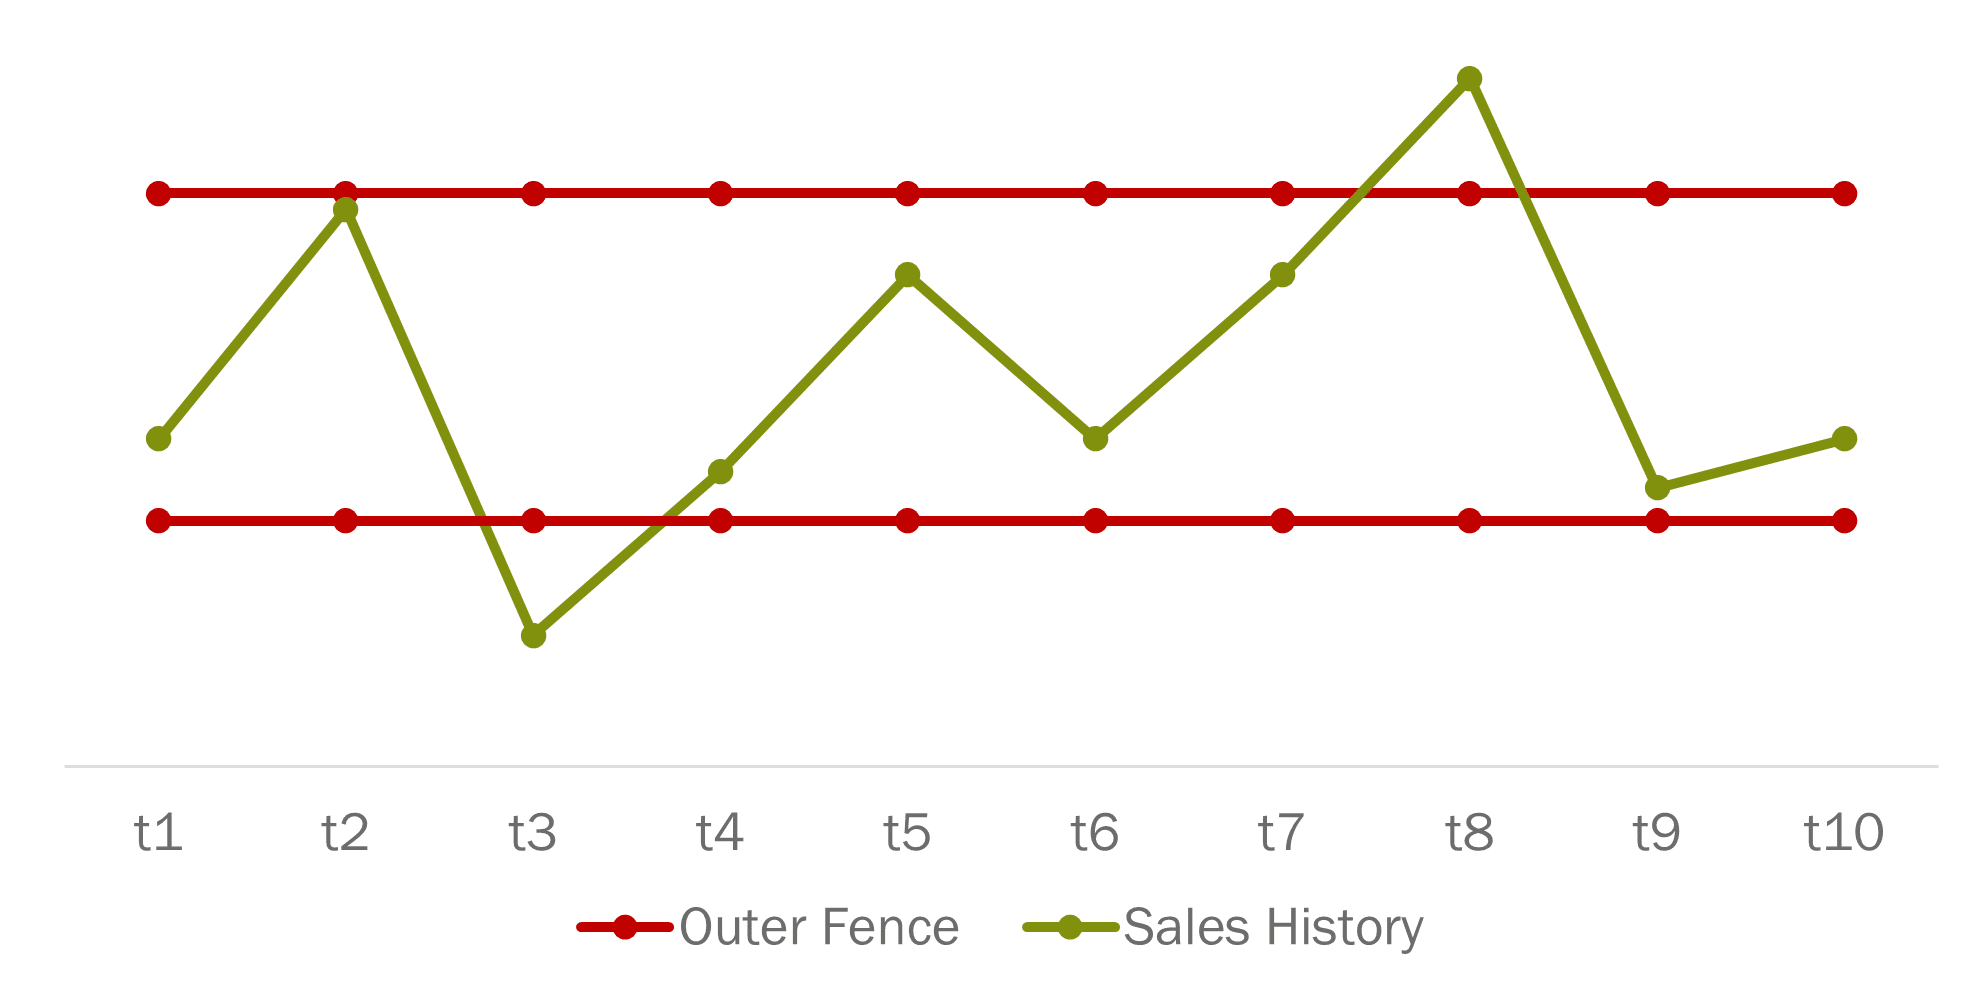
Figure 1: Outlier Detection
In simple terms, for the identification of outliers, upper and lower limits are outer fence (shown here in red). As soon as a data point exceeds this tolerance range downwards or upwards, the point is identified as an outlier (here in t3 and t8). In the next step, an outlier can be automatically replaced, for example, by the mean value or by the median.
Trust, But Verify
Although automatic data cleaning seems very attractive, the result should be checked by the planner. In this case, IBP Alert offers key figures that mark corrected values in the time series. These can then be confirmed or corrected if necessary. The IBP Excel Add-On provides a familiar and clear environment for this process.
In the following example, an outlier was identified in the sales history in the month of August 20 and colored in red by the alert. This value was replaced by the algorithm (here in green).

Figure 2: Outlier correction with the Excel Add-On
Once the forecast input has been corrected, it can be incorporated into the forecasting algorithm.
Conclusion
We hope you enjoyed this short excursion. Of course, this short article cannot cover the entire complexity of the IBP Outlier Correction. If you have any questions, please let us know in the comments. We would also be happy to discuss your specific requirements and challenges. Please feel free to contact us by mail.
________
[1] See Rob J. Hyndmann; George Athanasopoulos, 2018, Forecasting: Principles and Practices
[2] See https://demand-planning.com/2020/02/05/how-to-identify-treat-outliers-in-demand-planning/
Recent Comments